In last week’s episode we loaded up the original ZX Spectrum Manic Miner snapshot, and started ripping level information from it. This week I want to extend this and lift the tile information out, and build graphics dynamically based on the original ZX Spectrum graphics. Looking at the online format document we can see that the block graphics reside at 544 to 615. Each room has 8 blocks, each being 9 bytes in size. These are simple mono blocks where each bit of a byte is a pixel. 8 bits in a byte, and 8 bytes gives us our 8×8 block, while the first byte is the colour attribute. First off we’ll read in this data into a buffer, splitting the graphic from the attribute. Incidentally, the attribute matches to the value we read from the screen map. As we found last week, Manic Miner doesn’t store simple tile numbers, but attribute numbers, an these values match to the ones we’re about to read – but more on that later.
// read block graphics
var add = base_address+544;
var blocks= [];
var attrib = [];
var index = 0;
for(var blk=0;blk<8;blk++)
{
    attrib[blk] = buffer_peek(game, add++, buffer_u8);
    for(var b=0;b<8;b++){
        blocks[index++] = buffer_peek(game, add++, buffer_u8);
    }
}
level.attrib = attrib;
level.blocks = blocks;
Now this chunk of code actually goes above the level map code, this is so we can match up the attributes later on. Once we’ve done this we’ve now got the actual bitmap data and colour in and easy to access array. Now, how are we going to convert this to a graphic we can use? There are a couple of ways we can go about this, one is to use buffers and then store on a surface, but my preferred way is to use draw_point(). Its easy to use and we can colour it however we like. So along with this code we’ll also create a surface variable. So right after the above code add this…
global.tile_surface = -1; Now we’ll add a draw event to the oController object and add a call to a new script – CreateGraphics();. Next create this script and we’ll do a simple loop to build our blocks. This will build ALL level graphics rather than for each level so it’ll be a one-off right at the start. Now, when dealing with surfaces you should make sure you create them in the draw event, not the create event. There are a few reasons for this, but the most important one is that surfaces can be lost – especially on mobile, and if you create it in the draw event, it will recreate itself easily once it’s lost. If the code is in the create event, you’ll have a problem recreating your surface later on anyway
In this case, we’ll create a surface 8 blocks wide, by 20 blocks deep – every block for every level, with each level being on a single row. Here’s the code for building our graphics…
/// @create the graphics we need
if(!surface_exists(global.tile_surface))
{
    global.tile_surface = surface_create(8*8,8*20);

    surface_set_target(global.tile_surface);
    draw_clear_alpha(0,0);

    // Loop through all 20 levels
    for(var lev=0;lev<20;lev++)
    {
        // Get the blocks for THIS level
        var blocks = levels[lev].blocks;
        for(var blk=0;blk<8;blk++)
        {
            // base of the binary bitmap for this block
            var xx = (blk*8);
            for(var yy=0;yy<8;yy++)
            {
                // Get a row of pixels, and then do 8 pixels per byte
                var row = blocks[(blk*8)+yy];
                for(var xi=7;xi>=0;xi--)
                {
                    if( ( (row>>xi)&1)!=0 ){
                        draw_point_colour(xx+xi,yy+(lev*8),$ffffff);
                    }

                }
            }
        }
    }
    surface_reset_target();
}
draw_surface(global.tile_surface, 10,10 );
This loops through all 20 levels, and then 8 blocks on each level, then 8 lines of each block, then finally each of the 8 pixels on that block. The draw at the end will show us what’s created – which should look something like this!
All going well you should see the ties above on screen, at which point you can remove the draw surface at the end. Now we’ll try and draw the level using the actual graphics, and to do this we need to delete the platform creation in the ChangeLevel() script. We’re doing this as we’re going to draw the tiles in one go inside the draw event of the oController object. Paste this into the draw event, just after the CreateGraphics() call. What this does, is loop through the level tile map and using draw_surface_part(), draw the correct tile, at the correct location.
var lev = levels[CurrentLevel];
var tilemap = lev.tilemap;
var index=0;
for(var yy=0;yy<16;yy++)
{
for(var xx=0;xx<32;xx++)
{
var block = tilemap[index++];
draw_surface_part(global.tile_surface, block*8,CurrentLevel*8,8,8, xx*8,yy*8);
}
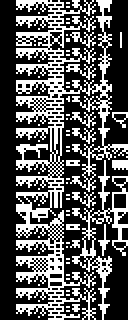
}Or rather…. it should. If you run this, you’ll get some odd-looking level like this (below). Now, the reason we get this is because the tile map isn’t a map of tiles – yet, it’s a map of attributes that the tiles use. In order to get actual tile numbers, we need to change our level map reading, to find the tile that the attribute references.

To get the proper tile number, we’ll replace the inner loop of the level map reading to this…
for(var xx=0;xx<32;xx++)
{
var block = buffer_peek(game, add++, buffer_u8);
var found=false;
for(var bb=0;bb<8;bb++){
if( attrib[bb]==block) {
block=bb;
found=true;
break;
}
}
tilemap[xx+(yy*32)] = block;
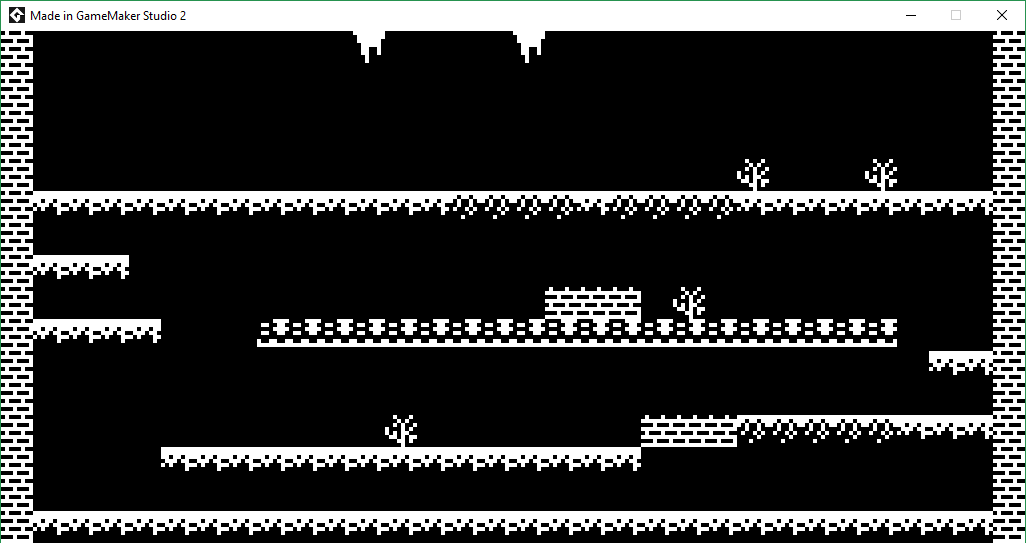
}Now we’re talking! When you run this you’ll get a mono version of the level – or in fact, LEVELS! Because if you use left and right you can now view all the levels!

The last thing I want to do this week, is to add the colours to the level, as we do in fact have the attribute associated with each tile! For this to work, we’ll need to decode ZX Spectrum colours in an easy manner. This is pretty simple, and all we need to do is a simple script that takes a 0 to 15 and returns an BGRcolour – like this (called GetColour()).
/// @description Get the BGR of the ZX spectrum colour
/// @param col The ZX Spectrum colour

switch(argument0)
{
    case 0 :    return $000000;     // black
    case 1 :    return $c00000;     // blue
    case 2 :    return $0000c0;     // red
    case 3 :    return $C000C0;     // purple
    case 4 :    return $00c000;     // green
    case 5 :    return $c0C000;     // cyan
    case 6 :    return $00C0c0;     // yellow
    case 7 :    return $c0C0c0;     // grey
    case 8 :    return $000000;     // bright black
    case 9 :    return $ff0000;     // bright blue
    case 10 :   return $0000ff;     // bright red
    case 11 :   return $ff00ff;     // bright purple
    case 12 :   return $00ff00;     // bright green
    case 13 :   return $ffff00;     // bright cyan
    case 14 :   return $00ffff;     // bright yellow
    case 15 :   return $ffffff;     // white
    default:
        return 0;
}
Now that this simple task is taken care of, we just need to build a coloured version of the tiles. First add this like above the blk loop inside CreateGraphics().
var att = levels[lev].attrib;Next above the yy loop we’ll add these lines….
var bright = ((att[blk]>>3)&8)
var paper = GetColour( bright | ((att[blk]>>3)&$7) );
var ink   = GetColour( bright | (att[blk]&$7));
This reads the attribute colour byte and splits it up into paper, ink and bright. And lastly, we’ll replace the inner xi loop of the pixel plotting code
for(var xi=7;xi>=0;xi--)
{
if( ( (row>>xi)&1)!=0 ){
draw_point_color(xx+xi,yy+(lev*8),ink);
}else{
draw_point_color(xx+xi,yy+(lev*8),paper);
}
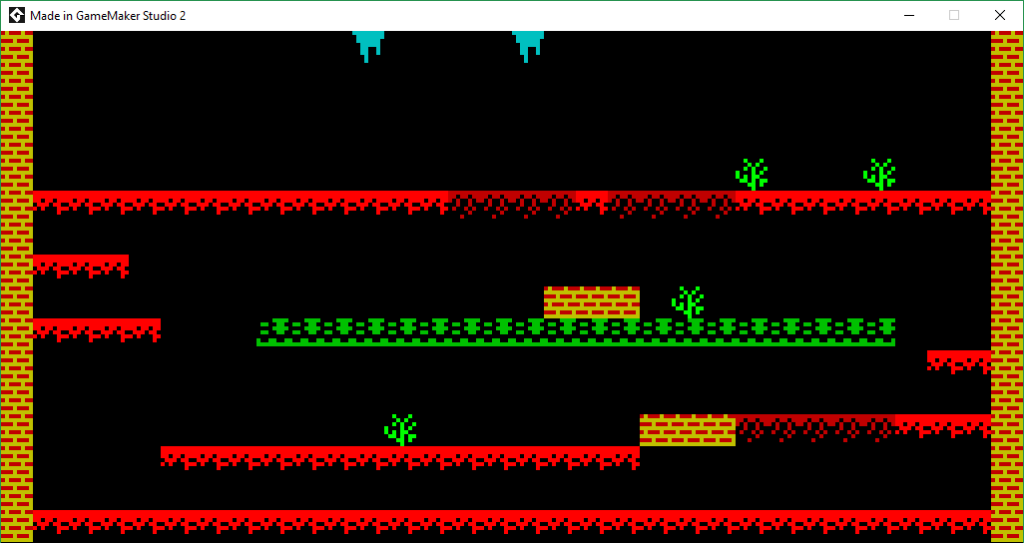
}So, if all that went well, you should now have a fully coloured level, like this!
That’s probably enough for now. In the next part we’ll take a look at extracting the items and the level name.